Your operation is not generic. Your model shouldn't be either.
Others extrapolate. We predict.
Most platforms that claim to do "prediction" take a vegetation vigor map (NDVI) and apply a generic formula to estimate yield. No calibration. No learning. The same model for a corn field in Iowa as for a soy operation in Mato Grosso.
LAYERS does something fundamentally different: we build an AI model trained exclusively with your operation's data.
What goes into your model
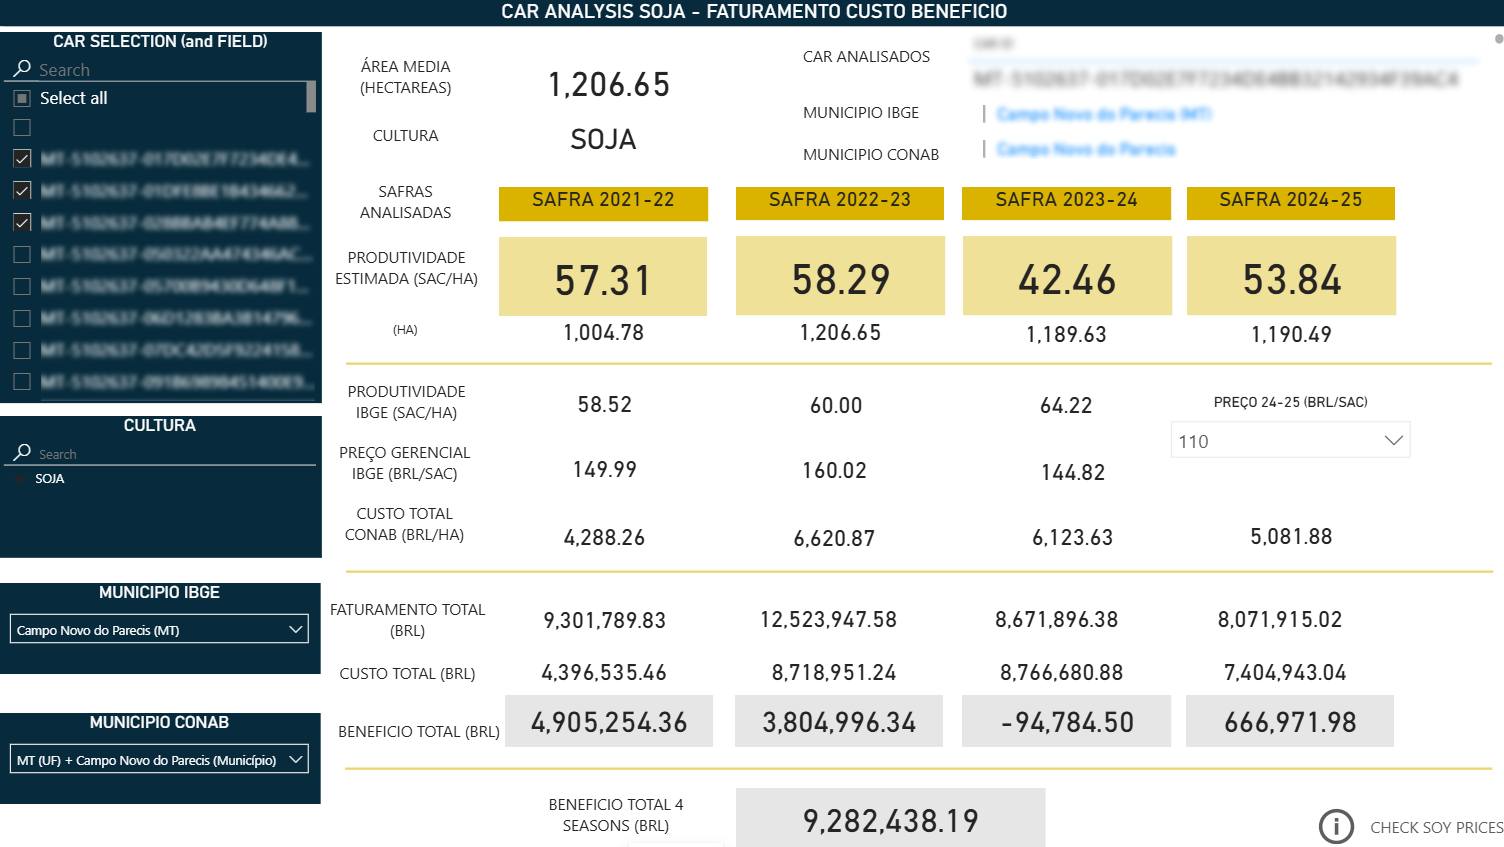
3+ years of historical data
The model learns patterns from YOUR soil, YOUR varieties, YOUR cycle
Multispectral satellite imagery
Real crop status in real time, every 5-12 days
Continuous climate data
Variables that affect yield: rainfall, temperature, radiation
Field samples
Cross-validation with real data from your agronomists
Trained exclusively with your data
What comes out
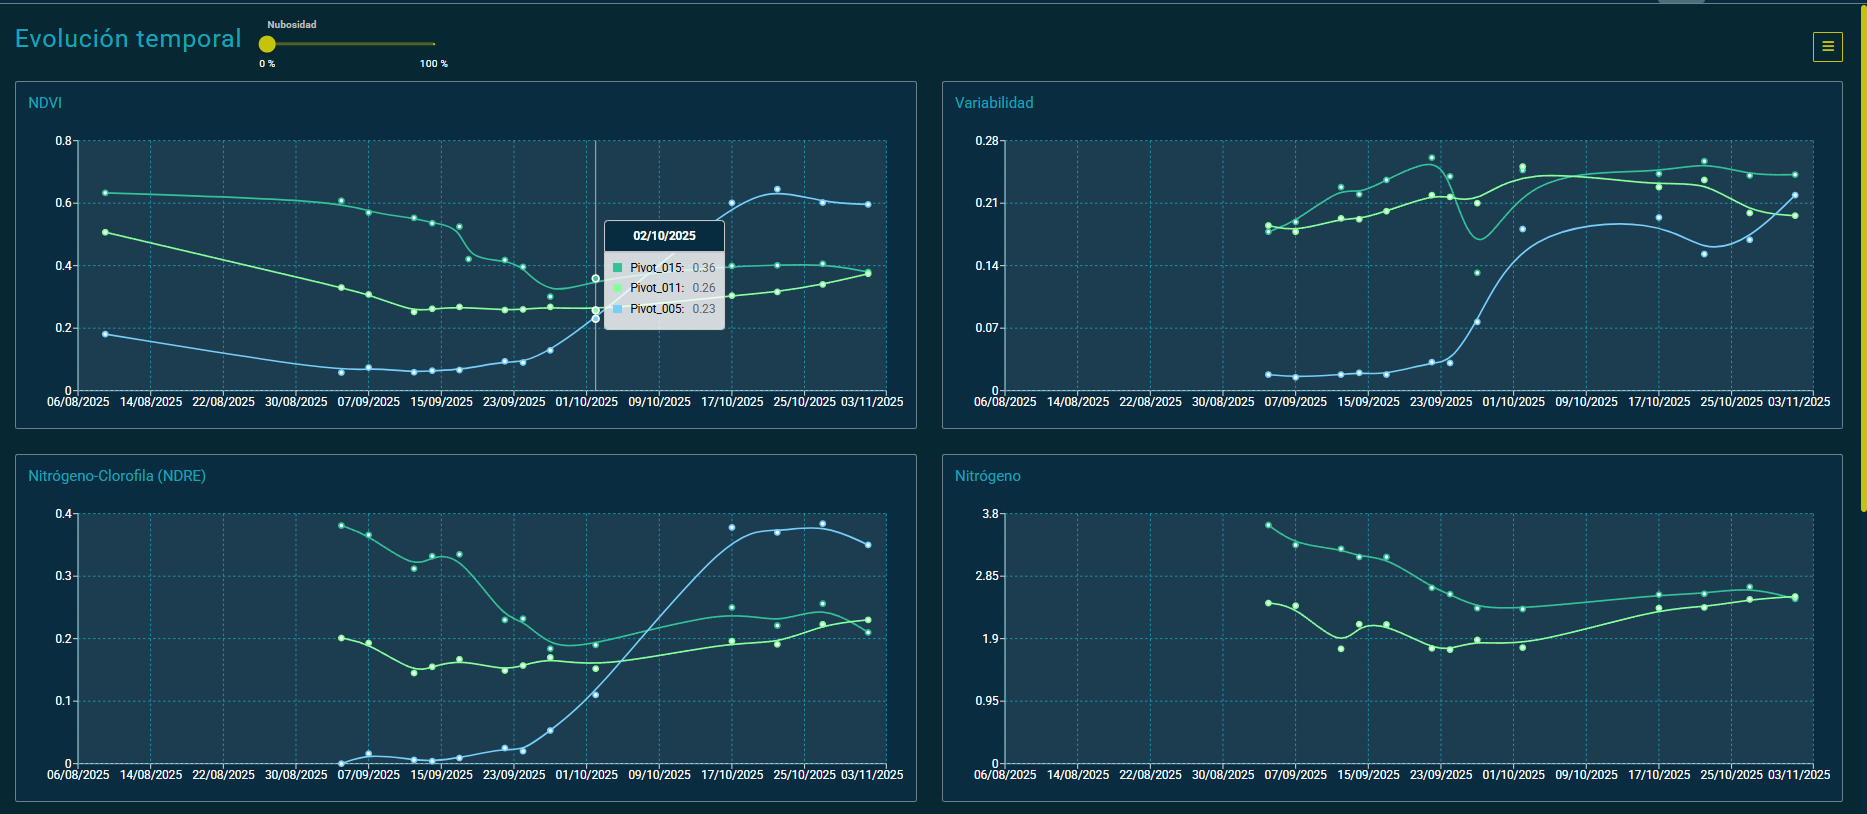
Weekly per-parcel yield predictions. Tons per hectare. Updated every week. Available in dashboard, CSV, API, or PowerBI.
And a model that improves with every season: quarterly retraining with new data, quality filtering, and integration of technological improvements.
This is what your team opens every Monday morning
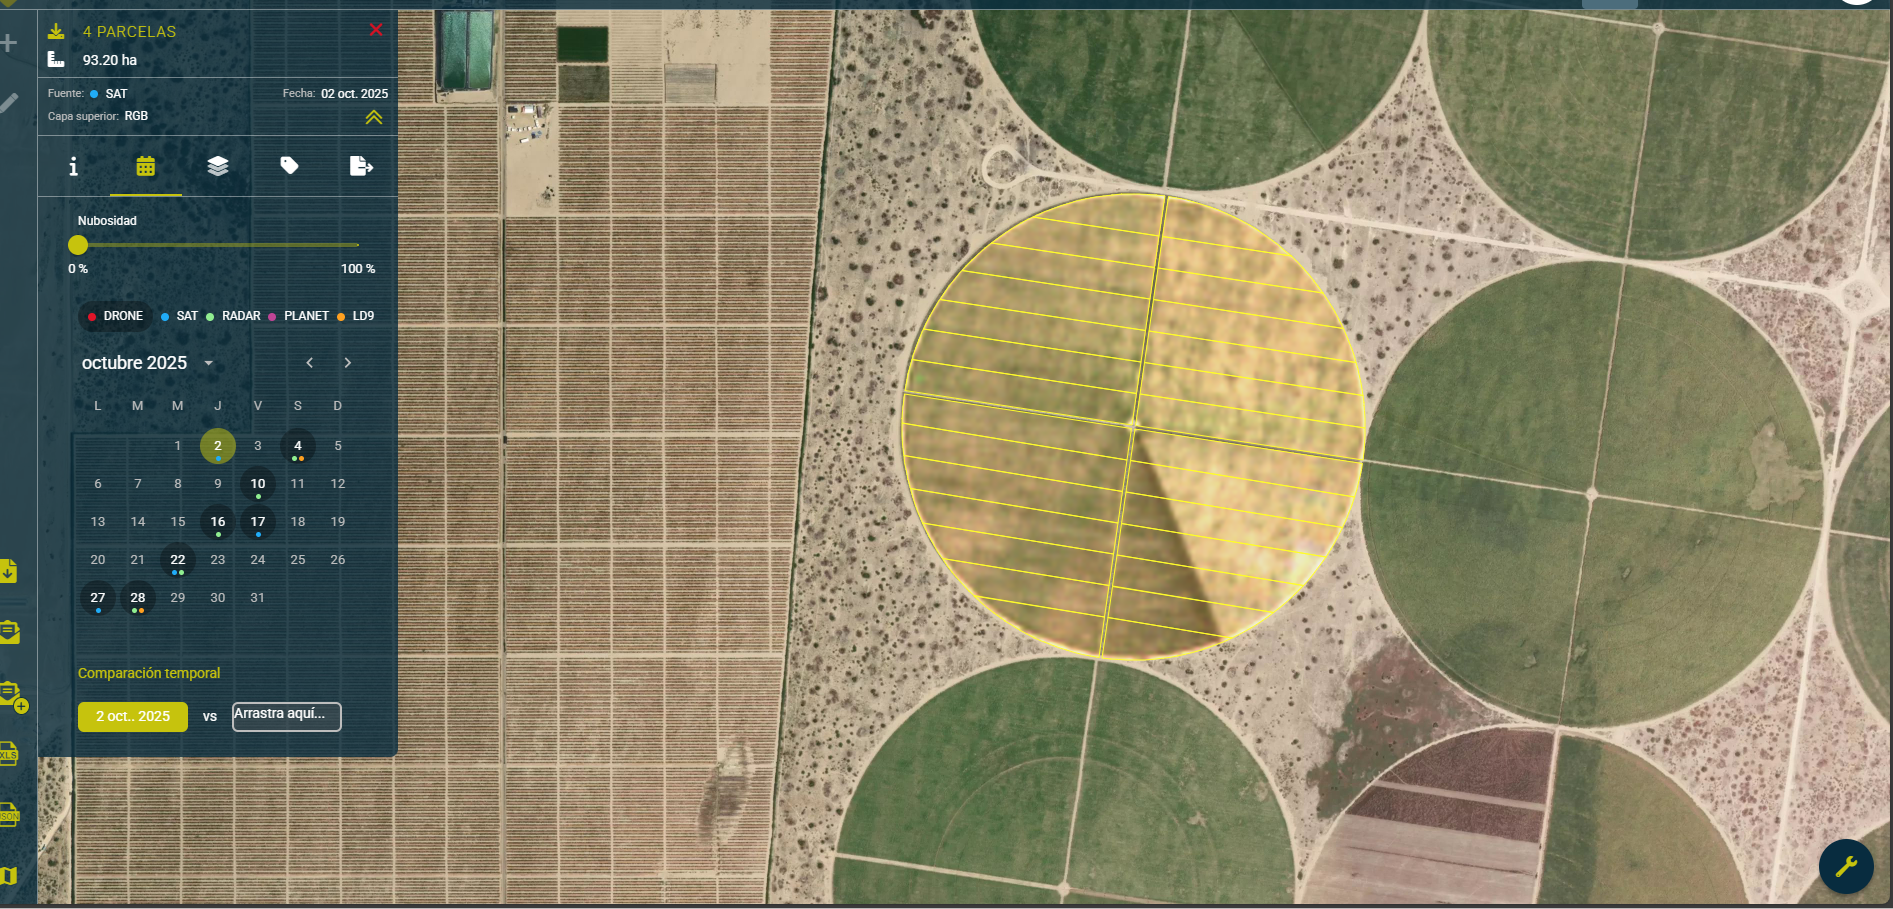
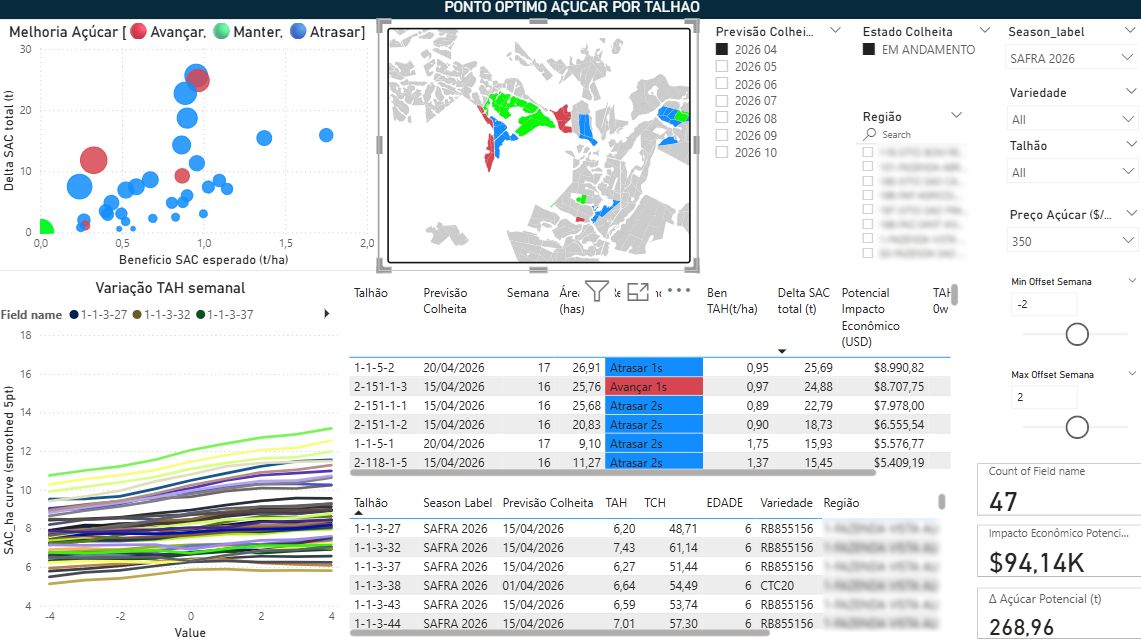
Parcel map with estimated yield per lot, color-coded by range